Solving a High Compute Usage Problem in One of My Web Apps
4 min read
The setup
I run a handful of small personal web apps on Vercel. Two of them, a task manager and a bookmarks manager, store their data in the same Neon Postgres project on the free plan.
That plan includes 100 CU-hours of compute per project per month. Neon suspends the compute after 5 minutes without activity and wakes it on the next query. In theory, a database used by one person should barely touch that allowance.
The problem
Since the second half of September, my Neon compute usage had been running high, and I couldn’t find out why.
On October 3, the Neon console showed 8 CU-hours already used for the month. That was after about two and a half days.
At that pace I would run out before the end of October. My own use of the two apps didn’t seem like enough to explain it, so something else was keeping the database awake.
Does Neon have an analytics API?
My first question was whether Neon offers more detailed usage data than the console. It does, but on the free plan the useful part is not where I expected it.
- Consumption history API. It returns per-project usage by hour, day or month, but Neon’s usage documentation says it requires a paid plan.
- Project details endpoint. On the free plan, Neon points you to cumulative counters such as compute time and active time for the billing period. For my project they all came back as zero, so I relied on the console’s figure instead.
- Operations endpoint. It lists every compute start and suspend with a timestamp, and it works on the free plan. This is the one that solved the problem.
How I investigated it
I did the investigation with Claude, which has access to my Neon, Vercel and Craft accounts through MCP connectors. My web app documentation lives in Craft, so Claude could see which apps use the database before looking at any logs.
- Check the compute configuration. The compute is fixed at 0.25 CU, the same value for minimum and maximum. Autoscaling couldn’t cause spikes, so the usage was entirely about how long the compute stayed awake.
- Read the operations log. The compute started, stayed active for about 5 minutes 15 seconds, suspended, then started again about 11 minutes after the previous start. The cycle ran around the clock, including between midnight and 4 AM Montreal time. That ruled me out.
- Count requests per route in the Vercel logs. Over 24 hours, the task manager received about 80 requests, almost all from bots probing for configuration files. The bookmarks app’s RSS feed received 163 requests, and none were served from cache.
- Line up the timestamps. Each feed request matched a compute start within a second. A sample from October 3:
| RSS feed request (UTC) | Compute start (UTC) |
|---|---|
| 11:20:19 | 11:20:19 |
| 11:31:01 | 11:31:02 |
| 11:41:59 | 11:42:00 |
| 11:52:59 | 11:52:59 |
- Rule out the uptime ping. An uptime check hits the bookmarks app every hour, in a burst of 5 or 6 requests. Three of those bursts arrived while the compute was suspended and didn’t wake it. The requests stop at the app’s authentication check, before any database query.
- Identify the pollers. The logs don’t record user agents, but the two polling patterns matched two feed reader subscriptions I had added for testing: Birchfeed every 11 minutes and Inoreader every hour.
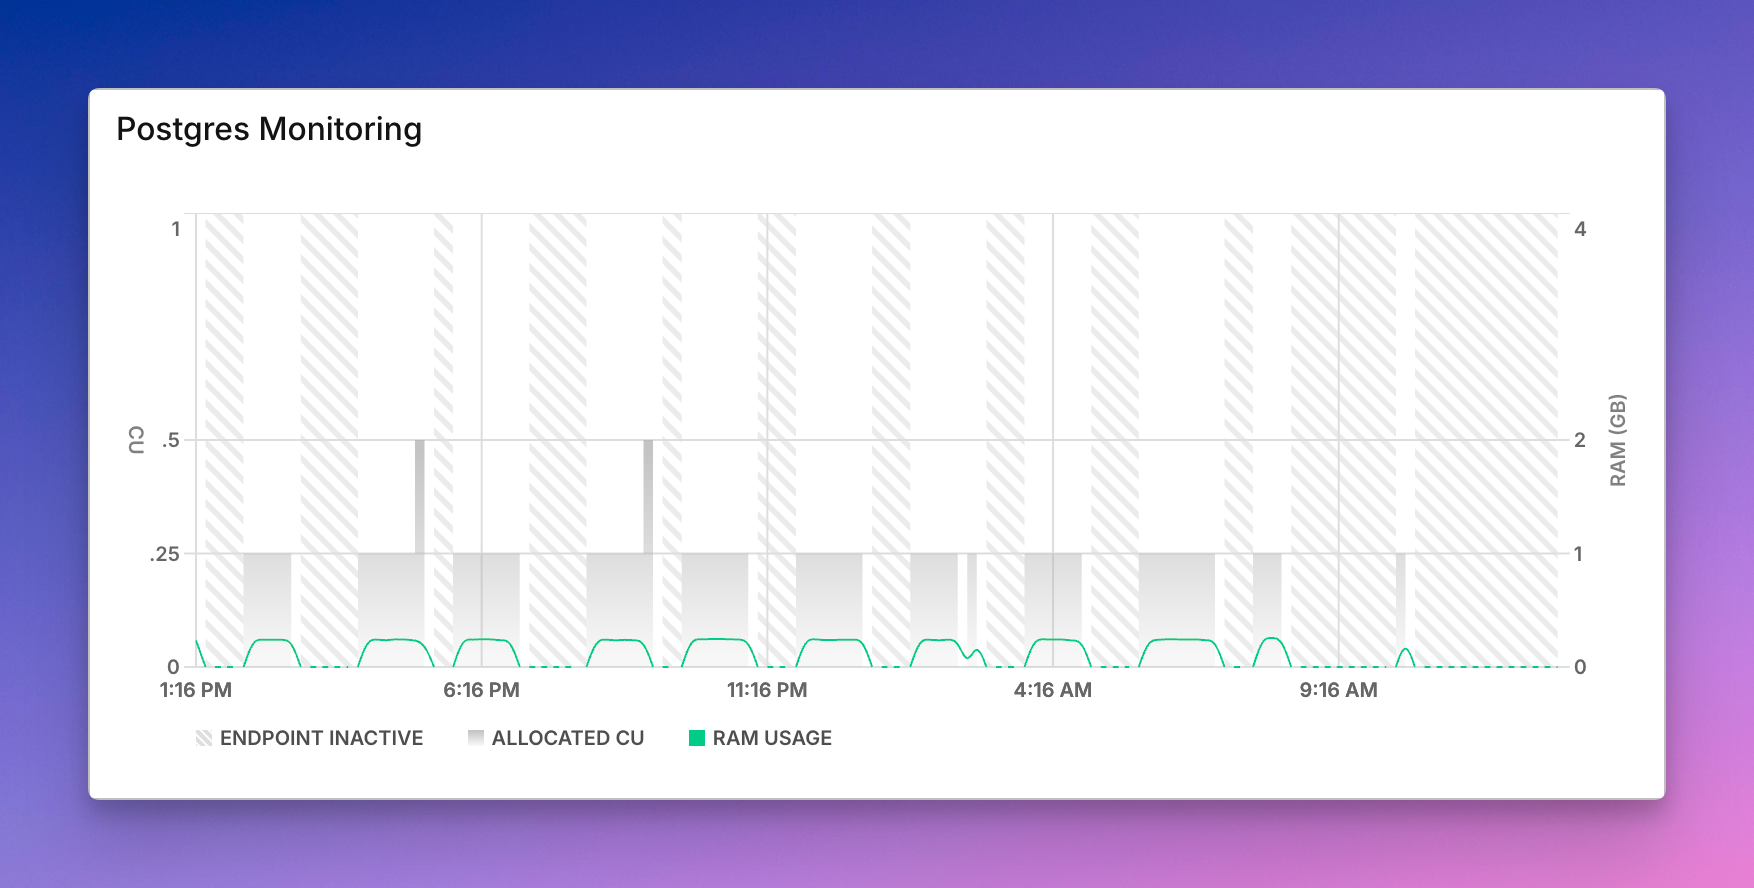
The two readers also explain how the problem built up. Inoreader’s hourly polling had been there for a while. At about 24 wakes a day, it cost roughly 16 CU-hours a month, a latent problem that stayed within the allowance. It got much worse when I started using Birchfeed, which polls far more aggressively and doesn’t let me set a polling interval per feed.
The math
On a database that scales to zero, cost follows the number of wakes, not the size of the queries. Each wake kept the compute on for about 5.25 minutes at 0.25 CU:
0.25 CU × (5.25 ÷ 60) h ≈ 0.022 CU-hours per wake
About 131 wakes a day added up to roughly 2.9 CU-hours a day. Over two and a half days, that is 7 to 8 CU-hours, which matched the console.
Over 31 days, it projected to about 90 CU-hours before any real use of the apps. A tiny query every 11 minutes was costing about as much as keeping the database on half of every day.
The fix
Both subscriptions were left over from testing and I didn’t need them, so I removed them. That took the polling away entirely.
I also considered making the feed cacheable at Vercel’s CDN, so polls would be answered without touching the database. With the readers gone, I didn’t need it. It remains the option if I subscribe to the feed again.
Now only real activity should wake the compute: my own use of the apps, writes from my automations, and two weekly archive syncs. I expect to finish October well under 100 CU-hours.